This section is written as a resource specifically for EMSC Program Managers and Project Directors in mind – or whomever will be managing the data collection for the state/territory.
What is it?
The EMS for Children Survey is a national survey deployed on a statewide level and collects the data for two of the EMSC Program’s performance measures
2.2 availability of individual(s) at a prehospital agency to coordinate pediatric emergency care – PECC and
2.3 availability and frequency of skill-checking on pediatric equipment.
The intent of both measures is to assess a prehospital agency’s ability to treat and care for pediatric patients – their pediatric readiness. For more information about these measures, check out the 2023 EMSC Performance Measure Implementation Manual.
The rest of this page is organized to address the most frequently asked questions we receive from EMSC Program Managers and Project Directors about deploying this survey and the data collection.
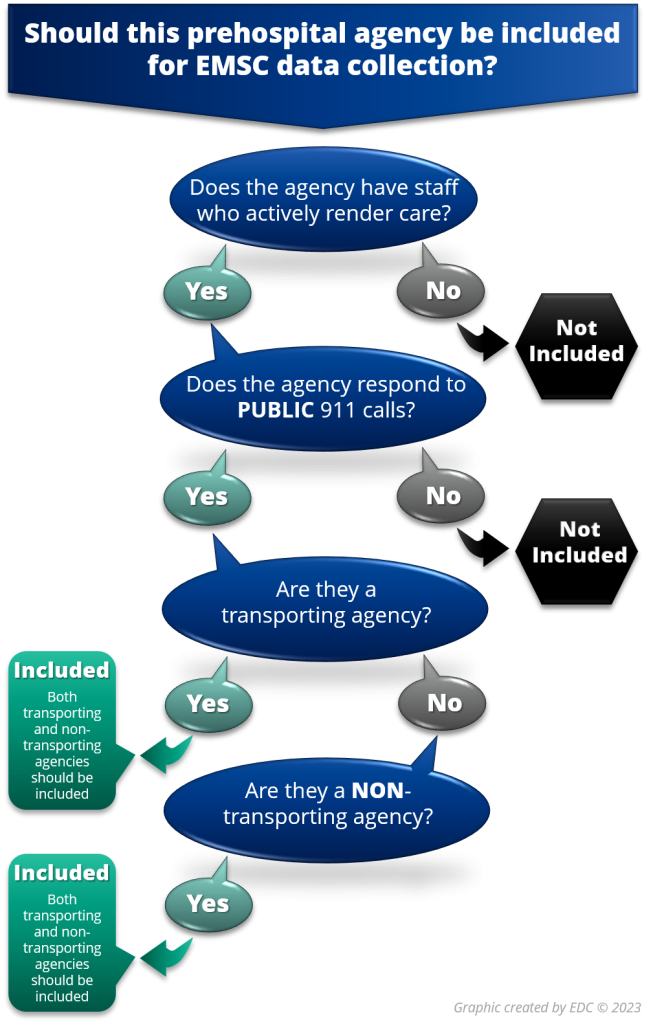
According to the definition in the 2023 EMSC Performance Measure Implementation Manual, a prehospital agency is defined as an organization staffed with personnel who actively render medical care in response to a public 911 or similar emergency call. This definition includes transporting and non-transporting agencies. The survey is intended to be completed by the prehospital agency director (or equivalent) who has day-to-day knowledge of operations.
A list of these agencies for each state/territory with designated contact is in the EDC’s secure online Contact List Management System (CLMS). EMSC Program Managers have 24/7 access to the CLMS for updating, verifying, and managing their list of agencies as well as the contact information.
The list of prehospital agencies in CLMS is vital for the data collection because it populates the survey website and some of the secure state/territory Tableau dashboards. Before each data collection begins, EDC staff will prepare a data quality report showing any data issues in your prehospital agency list like missing contact information which is needed for deployment. Links to the secure CLMS and Tableau systems for Program Managers can be found on our EDC & TA section under the Program Manager Secure Login at the bottom of the page.
The 2023 EMSC Performance Measure Implementation Manual indicates a goal of an 80+% response rate. The higher the response rate a state/territory receives, the more confidence we have that the results are representative of the situation in their state/territory.
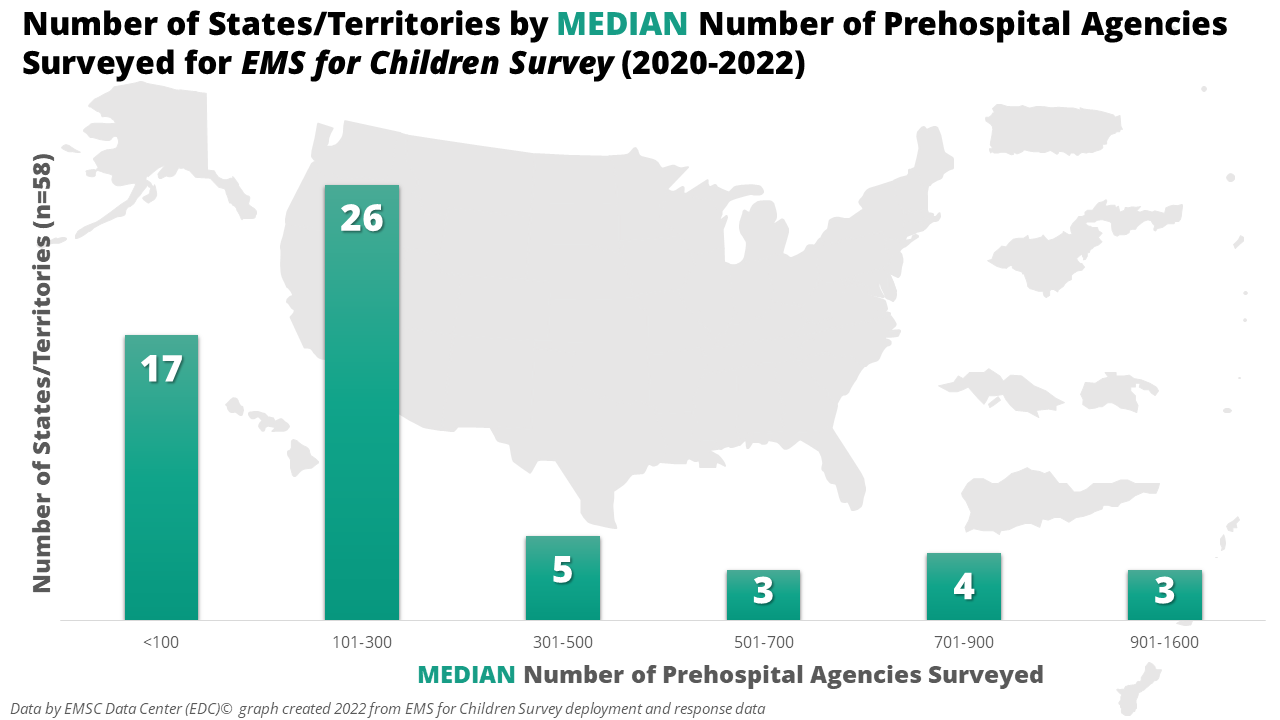
The number of prehospital agencies per state/territory that meet the Program’s definition varies; therefore, so does the amount of effort for the data collection. We analyzed the MEDIAN number of prehospital agencies surveyed between 2020 and 2022 per state/territory.
This distribution of states/territories by median number of prehospital agencies is shown in the graph below. Almost 75% of the 58 states/territories have less than 300 prehospital agencies which accounts for only 34% of total median number of agencies surveyed from 2020 to 2022.
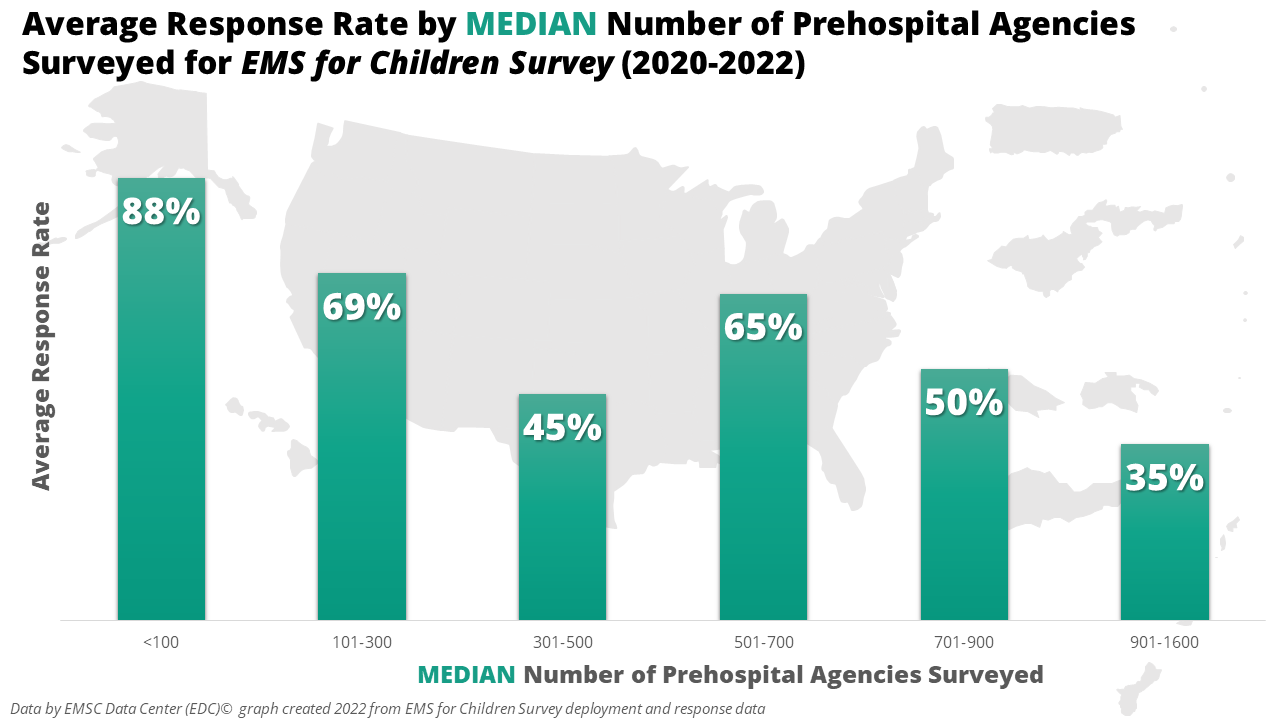
Because the amount of effort needed to achieve an 80% response rate varies according to the total number of prehospital agencies being surveyed, we looked at the average response rate compared by median number of prehospital agencies for states/territories. The graph below shows the average response rate by the median number of prehospital agencies surveyed by states/territories over the course of three data collection periods.
For congressional justification, EMSC State Partnership grantees are required to collect and report data on performance measures 2.2 and 2.3 annually.
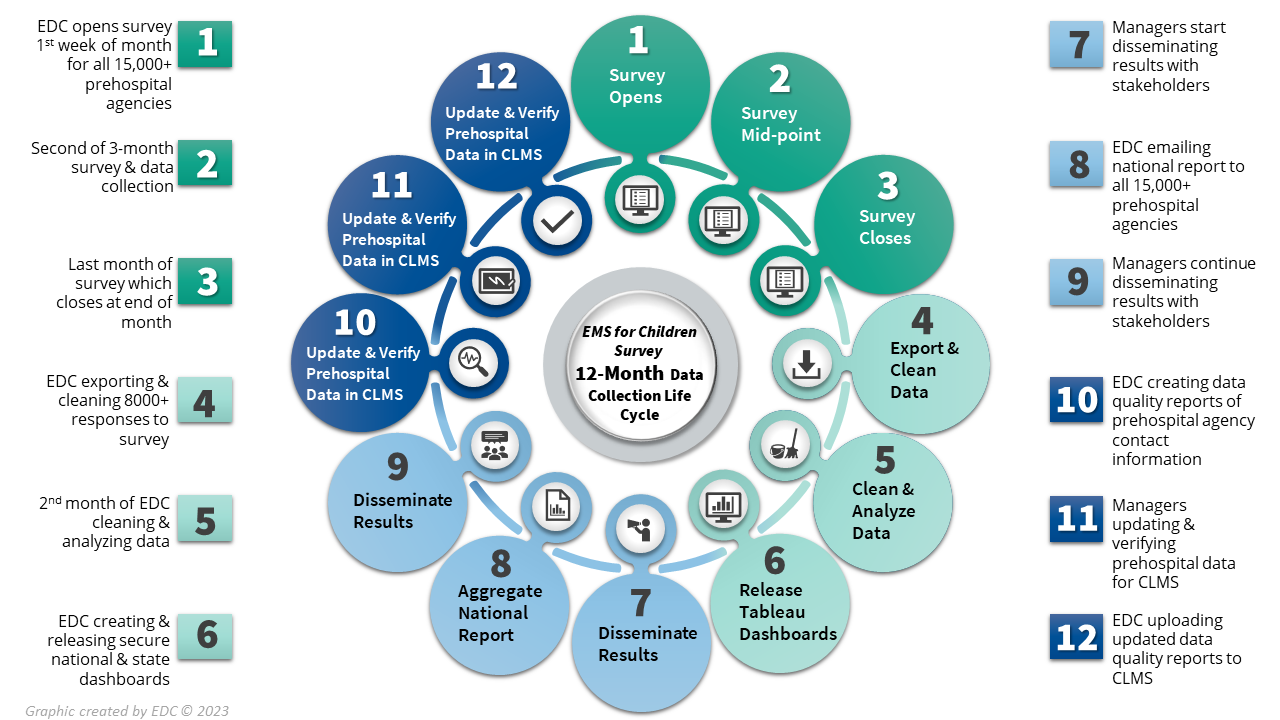
Click on the graphic below to see and download a higher resolution infographic of the EMS for Children Survey involves a 12-month data collection life cycle.
Before the survey opens – 1st week of January – it is headed by Program Managers updating and verifying the prehospital agency contact information listed in CLMS. The EDC helps Managers with this part of the process by creating state/territory-specific data quality reports of this information which show the data quality issues. Data quality issues can include missing contact information and/or information being in all capital letters or all lower-case letters.
Once the survey opens, prehospital agencies have three months to complete the 6-minute survey. Once a survey has been completed for an agency, their name is greyed out and becomes inactive on the survey website to decrease duplication of effort. Managers can monitor respondent and non-respondent prehospital agencies in the EDC’s secure Tableau dashboards.
The survey closes at the end of the third month. The weeks following the close, EDC staff export the estimated 8,000+ responses. EDC staff then spend 1.5-2 months cleaning the data so they can analyze it for national and state/territory results. Cleaning and analysis also include the preparation of the performance measure results in a report to HRSA and of addresses in proper form for geographic analysis into urbanicity levels. Approximately 3 months after the survey has closed EDC staff have created secure Tableau dashboards which they make available to Managers after HRSA approves release.
The three months following the Tableau dashboards are dominated by Managers sharing their results and educating prehospital agencies to produce improvement in the areas of pediatric emergency care coordination and skill-checking on pediatric equipment. During this period, EDC staff create a 3-page aggregate national report they email to all 15,000+ prehospital agencies listed in CLMS. You can view previous year’s national reports on our website.
EDC staff have some report templates for states to create similar reports of their data. We have also created PowerPoint slide deck templates where Managers can educate stakeholders about the performance measures or insert their state data related to this survey. These report templates and slide decks are available for download from our website.
At this point, the data collection life cycle has come full circle and starts the next year’s data collection with new data quality reports for Managers to verify and update prehospital agency contact information. During the three months before the survey launch, Managers promote it with prehospital agencies. Managers can find marketing materials for this survey on our website.
While the EMS for Children Survey is a national survey, EMSC Program Managers can choose between two survey communications options.
Survey Communications Option 1 – EDC Administers
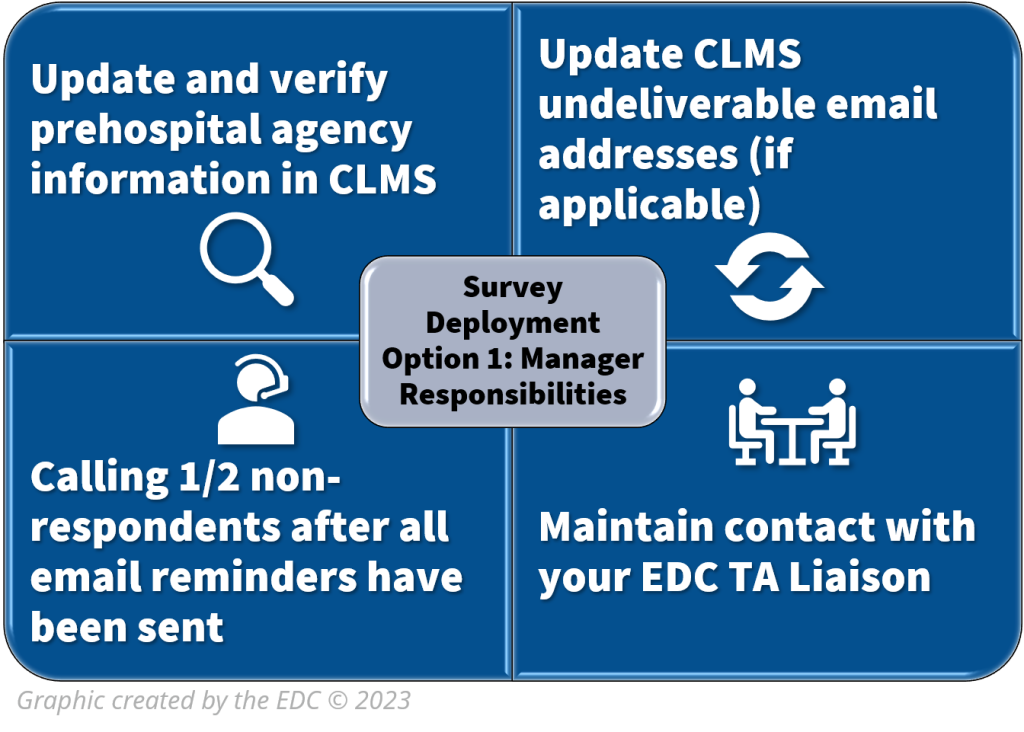
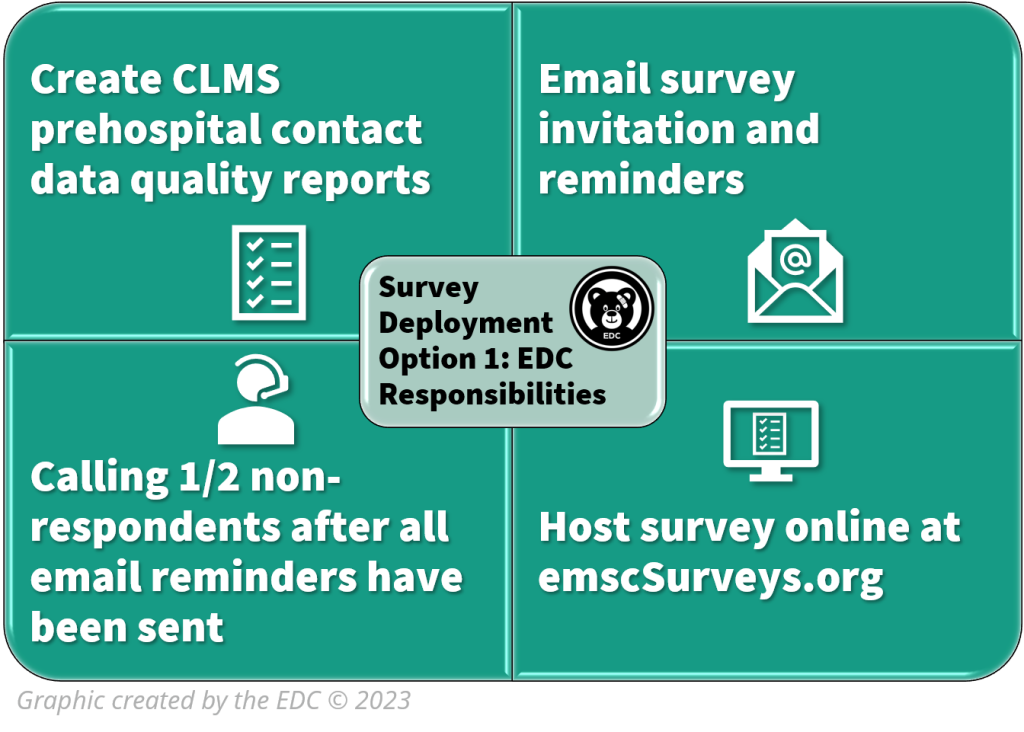
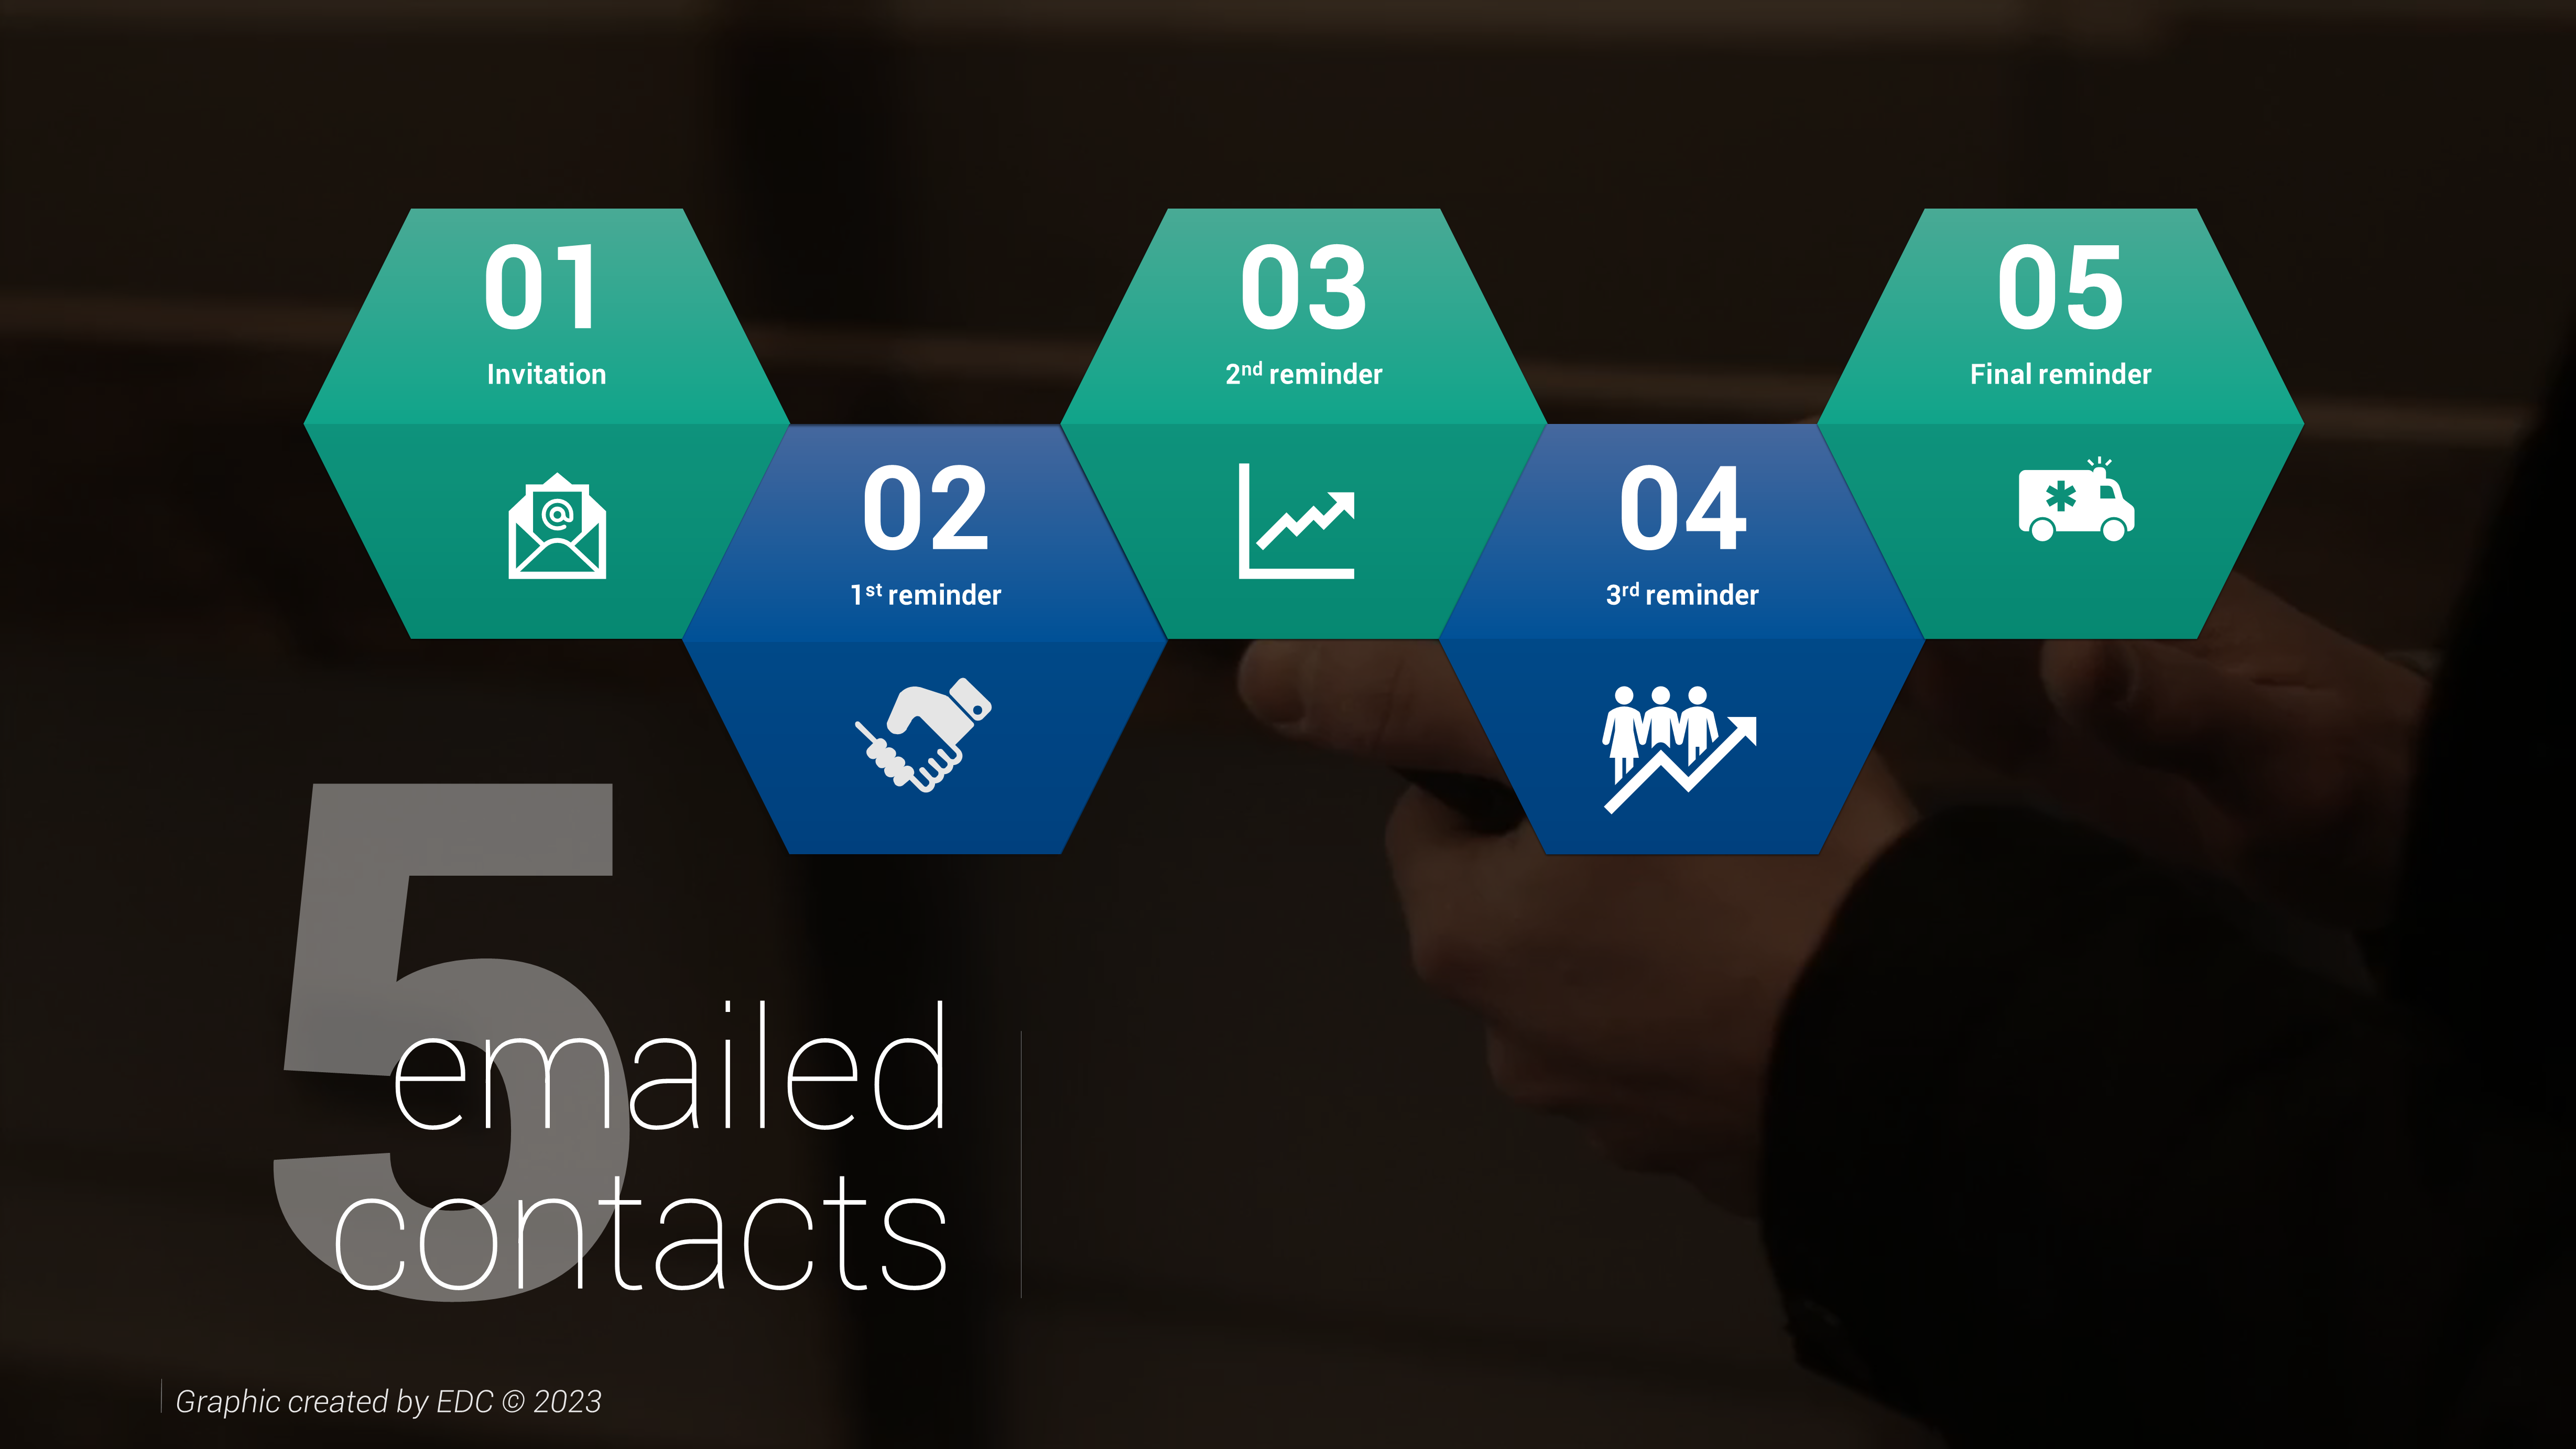
If a Program Manager chooses for the EDC to manage all their emailed survey communications (invitation and reminders), the EDC will send 5 total emailed communications and decide the content for each communication. For this option, Program Managers do NOT have the possibility to edit the content nor dictate the number of communications. In addition, the final contact involves calling non-respondent prehospital agencies. At that point, EDC will divide the list in 1/2. Program Managers handle calling one ½ of the total number of non-respondents.
Managers can find templates and promotional resources related to this survey on our website.
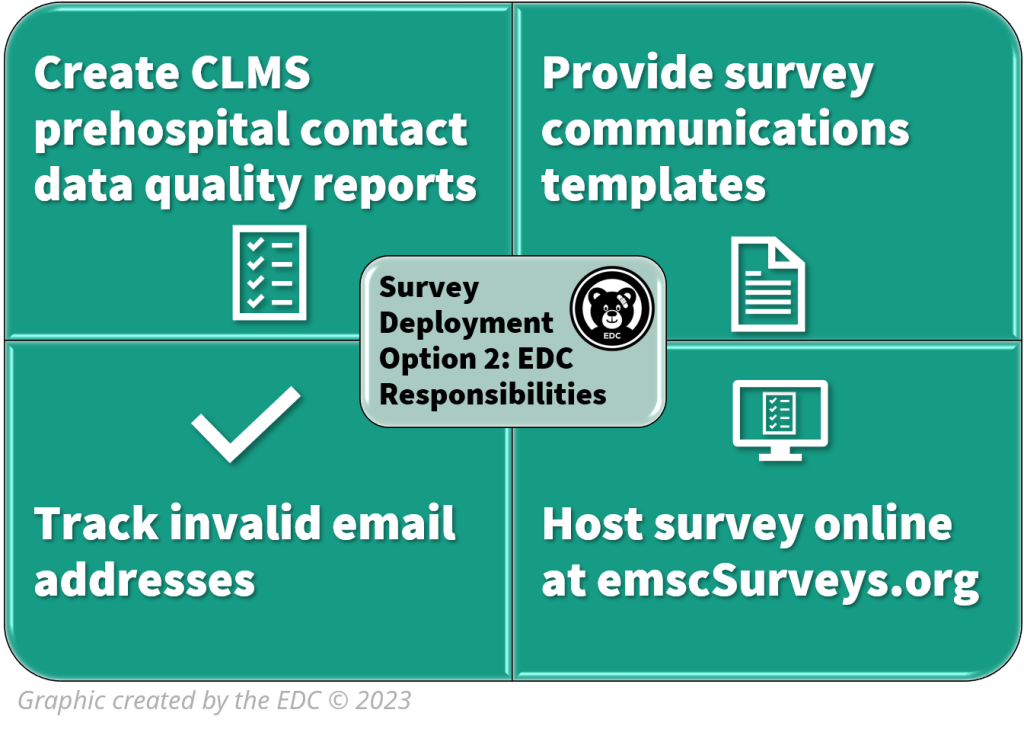
Survey Communications Option 2 – Program Manager Administers
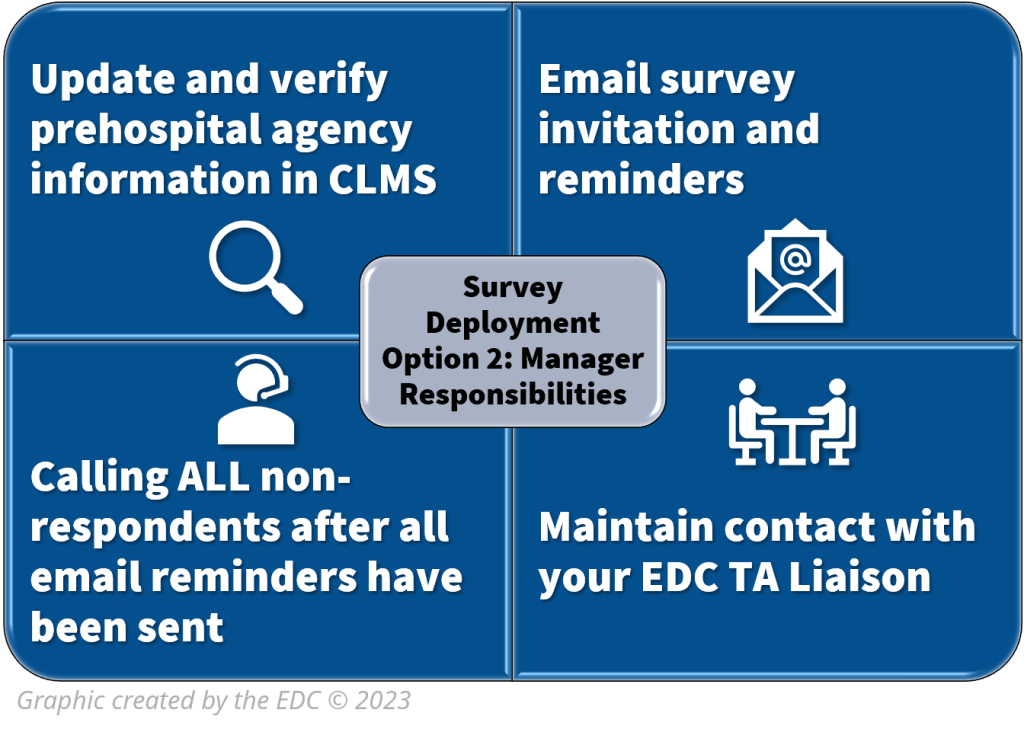
For option 2, Program Managers have autonomy in how many communications they send. While Managers can decide the content of these survey communications, EDC has created a template of each communication, based on proven survey methods. If a Program Manager chooses this option, they handle all telephone calls to non-respondent agencies.
Managers can find templates and promotional resources related to this survey on our website.
Any successful survey deployment begins with a strategic response rate plan of how many and when to send each communication. After reviewing evidence-based survey methods, the EDC has created strategic response rate plans for each survey deployment communications option. These response rate plans are available for download and customization from our website.
The response rate plans are based on general research of survey deployment. Having responses from such a large number of prehospital agencies across the nation (8000+), we conducted some deployment analyses to make strategic decisions about emailing the invitation/reminders and calling non-respondents. The EDC analyzed the data to decide the best day and time of day for these types of communications (invitation, reminders, and calling) with prehospital agencies.
Based on general survey methods research, most people start a survey shortly after they receive it, especially with emailed surveys. Based on this fact, we conducted some analyses related to survey deployment for the 2022 survey. Remember, all of this data is based solely on when agency administrators from prehospital agencies responded to the EMS for Children Survey.
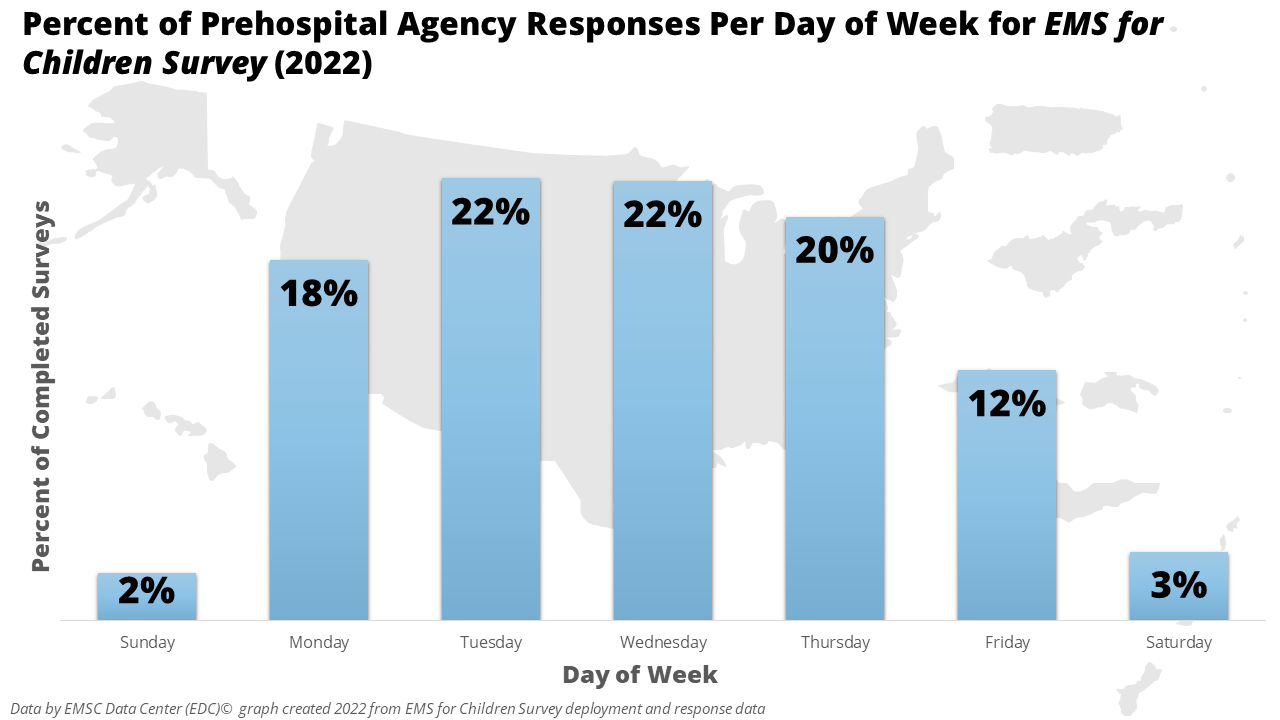
The graph below shows that there was a tie for the best day of week to send email invitation/ reminders and to call non-respondents. These two days of the week are Tuesday and Wednesday. Of the business workdays, Fridays should be avoided for emailing the invitation and reminders and calling non-respondents.
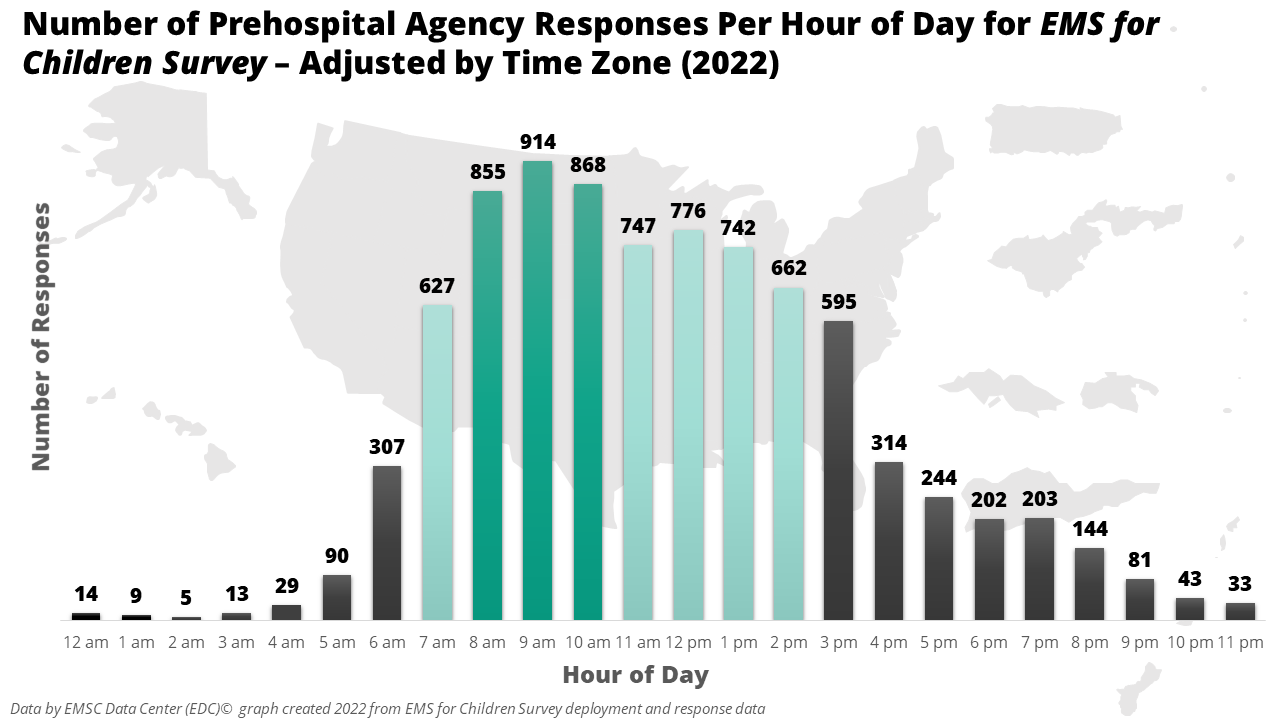
The graph below displays the number of surveys (8000+) started per hour of the day, adjusted by time zone. The horizontal axis shows the time of day by hour, and the total number of surveys submitted during that hour is on the vertical axis. For the EMS for Children Survey, the highest number of surveys were started between 8:00 am up to 10:59 am. Thus, those three hours are the best for sending an email or calling an agency to complete the survey. The data also shows the late afternoon of the workday should be avoided for survey communications with diminishing returns after the lunch hour.
Based on the time of day and day of week data, when do you think you might want to email and call non-respondent agencies the next time you need them to complete a survey?
Because most surveys are started shortly after a request is received, this data suggests that Tuesdays and Wednesdays between 8 and 11 am are the absolute best times for sending communications to agencies, and that afternoons, Fridays, and weekends should be avoided. In other words, you will get more return on your investment if instead of sending an email on a Friday afternoon before you leave work for the week, to wait until the next week and send it on a Tuesday or Wednesday morning. By following this strategy, you will have less work in follow-up and improved response rates.
Also, for congressional justification, the Program requires the data to be comparable across all states and territories. While the Program allows for state terms for the two previously mentioned survey question options, it is allowed because these questions are not used to calculate the performance measure numbers and therefore do not affect performance measure data quality and comparability.
The simple answer is that we are not allowed to change any wording in the survey for your EMSC data collection. The only exception is allowing states/territories to use their terms for the response options to the two survey questions related to prehospital agency and provider levels. For the response options to these two questions, we are able to pipe in state/territory specific terminology which EDC staff will verify with each Program Manager before the survey launches.
Please keep in mind this is a national survey for the federal EMSC Program. As such, it was subject to strenuous review and approval at the federal level through the Office of Management and Budget (OMB). This review and approval process took over a year after the Program had developed the final version of the survey – which was based on pilot testing and cognitive interviews. The Program even had to get approval from OMB to have the demographic survey questions to help Mangers and permission to let states/territories use their terminology in those 2 questions.
While EDC staff create state/territory versions of the survey with their custom terms, you can download a general PDF version of the survey from our website.